How to Use the Slope Angle and Aspect Map
Large avalanches tend to originate at slope angles near 40 degrees,
and slope angles between 30-50 degrees are considered especially dangerous.
This map is designed to let an individual perform their own slope analysis,
by overlaying both slope angles and aspects onto a web map
to help make smarter decisions in backcountry travel.
To learn how to use this map, we'll look at an example at the site of a
tragic well documented backcountry ski accident near the Stevens Pass Ski
Resort. You may be familiar with the
New York Times Article
about the avalanche at Tunnel Creek.
Here we take a look at the
slope angles and aspects
for Tunnel Creek and Cowboy Mountain. Click on the link to
open the map.
[Example Map]
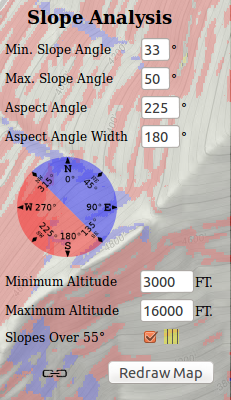
In this example I have highlighted south westerly facing slopes in red and
slope angles 33 to 50 degrees, which are marked on the map with the blue and red overlay.
Let's look at the settings to do this analysis.
From the first two input fields "Min. Slope Angle" and "Max. Slope Angle" I have set the slope angle range from a minimum
of 33 degrees to a maximum of 50 degrees. This sets the area on the map that is shaded
In the second two input fields
I've set highlighted aspects, the colors on the map, first I set a direction, in this
case 225 degrees, which is south west, and then a range to cover, in this case
180 degrees, which will shade everything facing the selected direction red
within your aspect range and everything blue
outside the set aspect range. If you play a little with these inputs you should
find it straight forward.
this is designed to highlight aspect specific problems like wind slabs or dangerous
warming areas with more sun exposure.
You can also set the focus on
specific altitudes, which is done from the min. and max. altitude inputs
Finally we've marked anything over 55 degrees in a
yellow with black lines, unless you know there's a route, it's likely that
these areas are cliff or rock faces and should be avoided, I personally find
this feature very helpful in avoiding getting "cliffed out".
Even a little yellow is usually a big cliff.
Any region that is outside the data range, either because of low altitude or
it's not within the set range, which for now is western U.S. in the lower 48,
is marked with a grey overlay.
A quick note on accuracy, this data is calculated from USGS data sources and is
accurate to 1/3 arc second, this means that each slope angle and aspect is an
average over a region about 30 feet square,
in addition there's errors
in the USGS data, it's not perfect.
Please keep this in mind and remember this is not a substitute for
field measurements.
You may notice from this map what many people knew,
Tunnel Creek on the backside of Stevens Pass Ski Resort is a dangerous
place to be with a large area of avalanche prone slopes capable of big slides.
A great way to learn from this map is to look at other avalanche accident
reports,
for example NWAC has great reports,
check out where the accidents happened and
under what conditions and at what slope angles,
and try to keep history from
repeating itself, be safe out there.